In the PLATIRUS project, the partners involved have been committed in the development of a complete flowsheet using more environmentally-friendly PGM recycling technologies than the current SoA. The obtained flowsheet is the result of the development of several novel alternative technologies and their consequent environmental analysis considering different applications. The final process combination of this flowsheet includes the following main steps:
- Microwave (MW) assisted leaching developed by VITO,
- Solvent extraction with ionic liquids developed by KUL,
- Gas-diffusion electro-crystallization (GDEx) for Pd recovery; cementation for Pt recovery and precipitation for Rh recovery developed by VITO.
CRF in collaboration with TECNALIA has performed an analysis of the environmental impacts of the PLATIRUS” process flowsheet, compared with a current industrial process (“State of the Art”, or “SoA”), with reference to the automotive ceramic catalyst application. This analysis has been conducted by applying the Life Cycle Assessment (LCA) methodology.
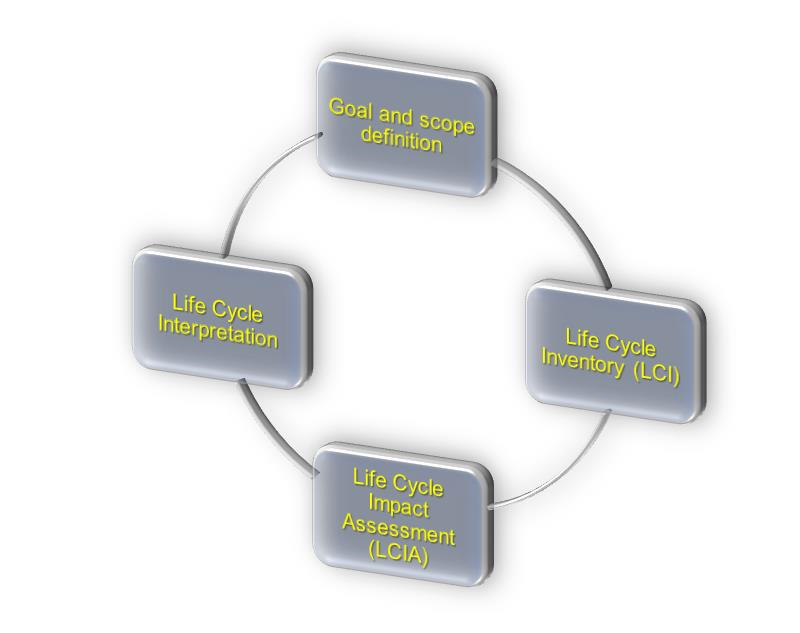
The objective of the LCA is to provide a quantification of the environmental burdens for each step of the entire life cycle of an investigated case-study and deals with four main phases (Figure 1): Goal and Scope definition, Life Cycle Inventory (LCI), Life Cycle Impact Assessment (LCIA) and Life Cycle Interpretation.
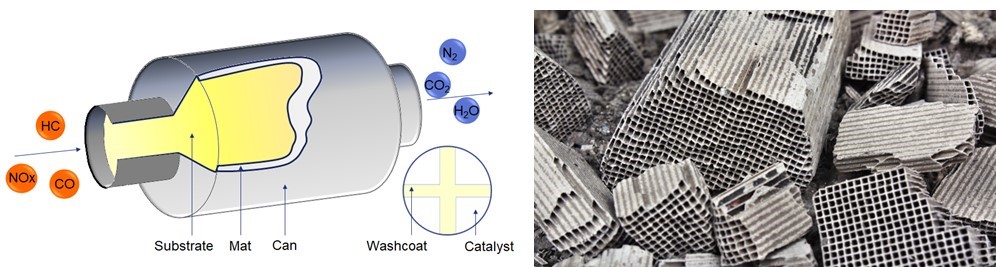
The Functional Unit for this analysis has been selected as “1 kg of End-of-Life automotive catalyst” (Figure 2). In order to perform the LCA it was necessary to involve the Consortium partners that developed the selected technologies (VITO and KUL). But also, a collaboration with ENV-AQUA, TECNALIA, JM and SINTEF were important to complete the data collection in the Inventory of the SoA technology as well.
The process steps considered in the SoA are pyrometallurgy and hydrometallurgy. However, since the data collected represent a simulation of the process (with HSC Sim software) which is perfectly optimized, in order to provide a fair comparison with the two technologies, an energy rate of 57 (with reference to the hydrometallurgical phase) has been applied to the impacts analyzed. In this way, the two processes are more comparable with each other in terms of Inventory data collected, especially for the energy input data.
The collected data have been processed with the Life Cycle Assessment Software “GaBi” in order to calculate the assessment of the environmental impacts. Concerning the PLATIRUS flowsheet, a scenario with 75% of recyclability of chemicals in the liquid-liquid separation phase has been considered; this seems reasonable since the current technologies already allow a recyclability rate of more than 60%.
The results of the Life Cycle Impact Assessment of the PLATIRUS flowsheet are reported in Table 1.
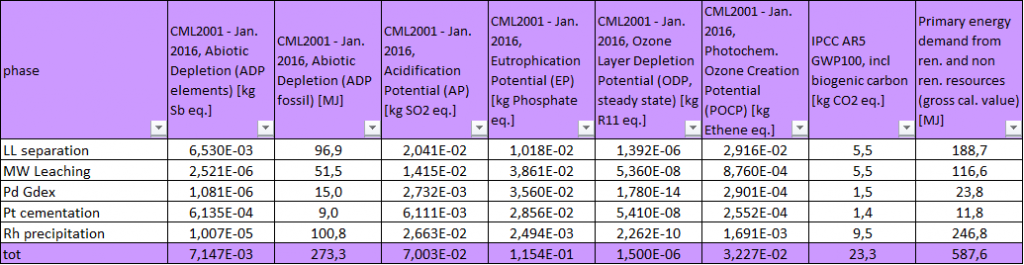
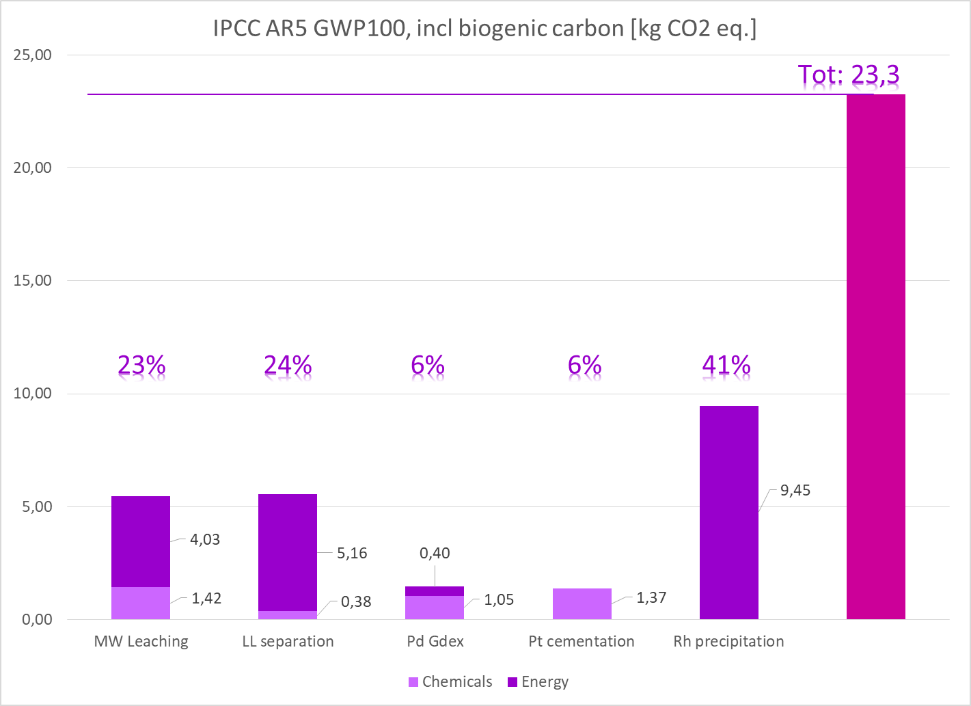
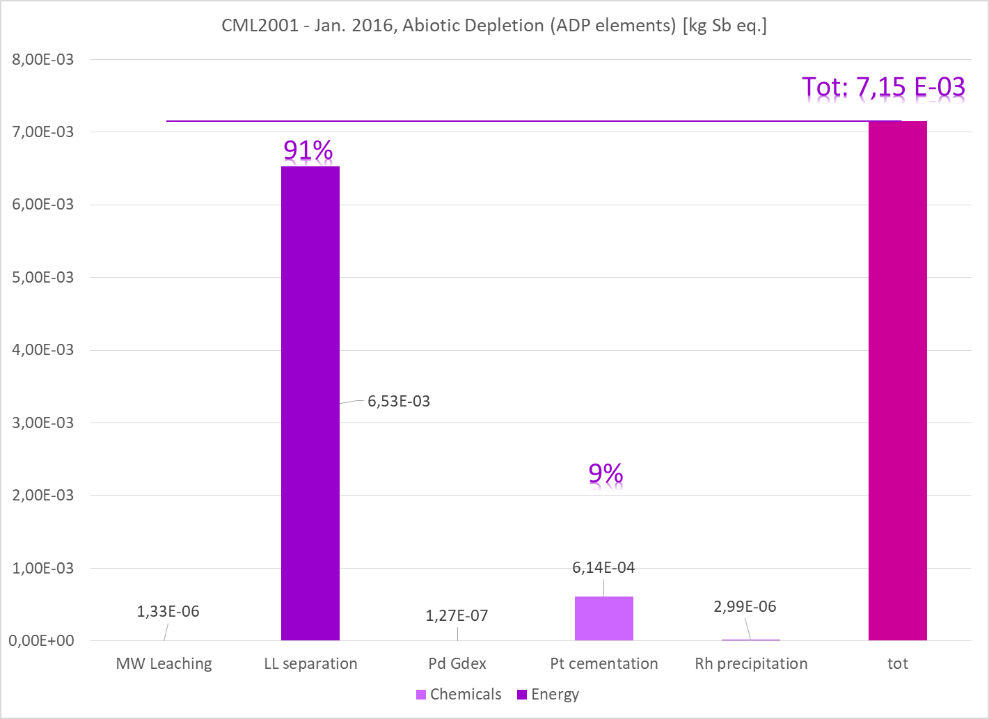
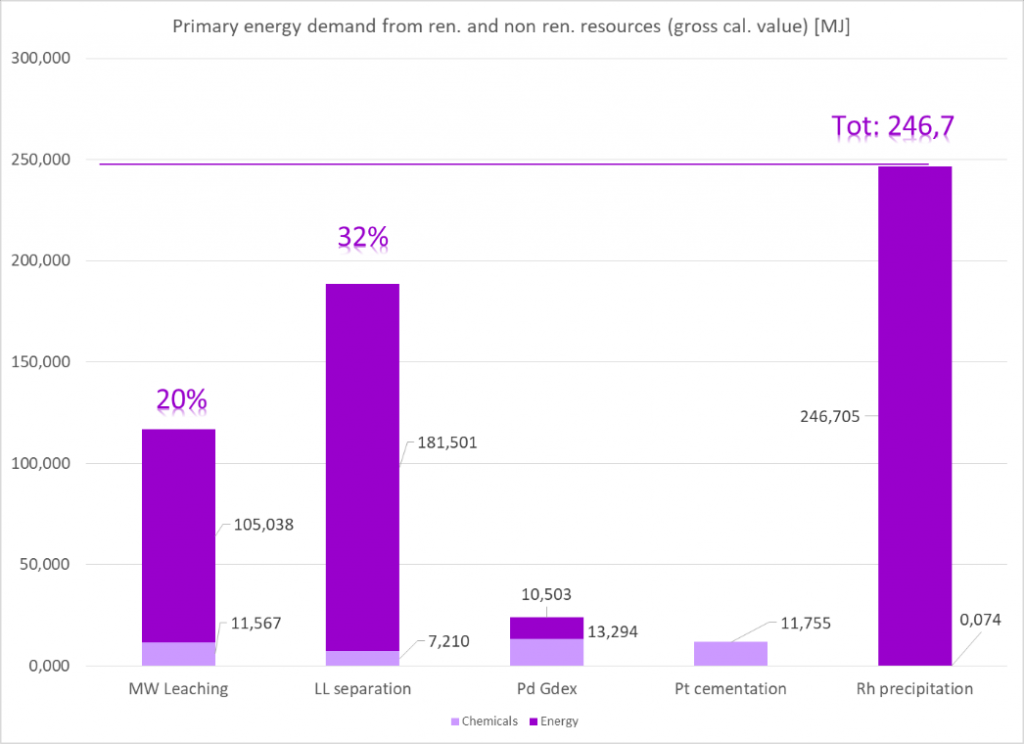
A focus on three environmental indicators (IPCC AR5-GWP, ADP elements and PED) has been carried out for both technologies in comparison with each other; in Figure 3,4 and 5 the results for the PLATIRUS flowsheet are graphically shown. In particular, a treatment of 1kg of spent ceramic automotive catalysts with the developed PLATIRUS process generates an overall GWP impact of 23,3 kg CO2eq., an ADP impact of 7,15E-3 kg Sbeq and a PED impact of 246,7 MJ. Looking at the three process steps (MW leaching, liquid-liquid separation and GDEx+Pt cementation+Rh precipitation) we can see that:
- for GWP, the energy impact of liquid-liquid separation and Rh precipitation that are respectively 17% and 41% of the total GWP;
- for ADP elements, the bigger part (91%) of impact is caused by the energy involved in the liquid-liquid separation phase;
- for PED, the bigger quota of impact is generated from MW leaching and liquid-liquid separation energies: summing up these energy quotas the result is that they are 49% of PED impact.
In conclusion, the results of this environmental analysis have highlighted that:
- The most significant contributions for the 3 environmental indicators are in charge of the liquid-liquid separation phase. That is mainly because of the high amount of energy required for this phase.
- With the energy rate applied (57), the PLATIRUS flowsheet, in the comparison with the SoA, is considerably more environmentally-friendly, since the GWP, ADP elements and PED values are only 10%, 45% and 12% respectively.
- These impacts, although already very encouraging, have still a quite great improvement potential as soon as the process will be optimised, especially regarding the energy consumption.